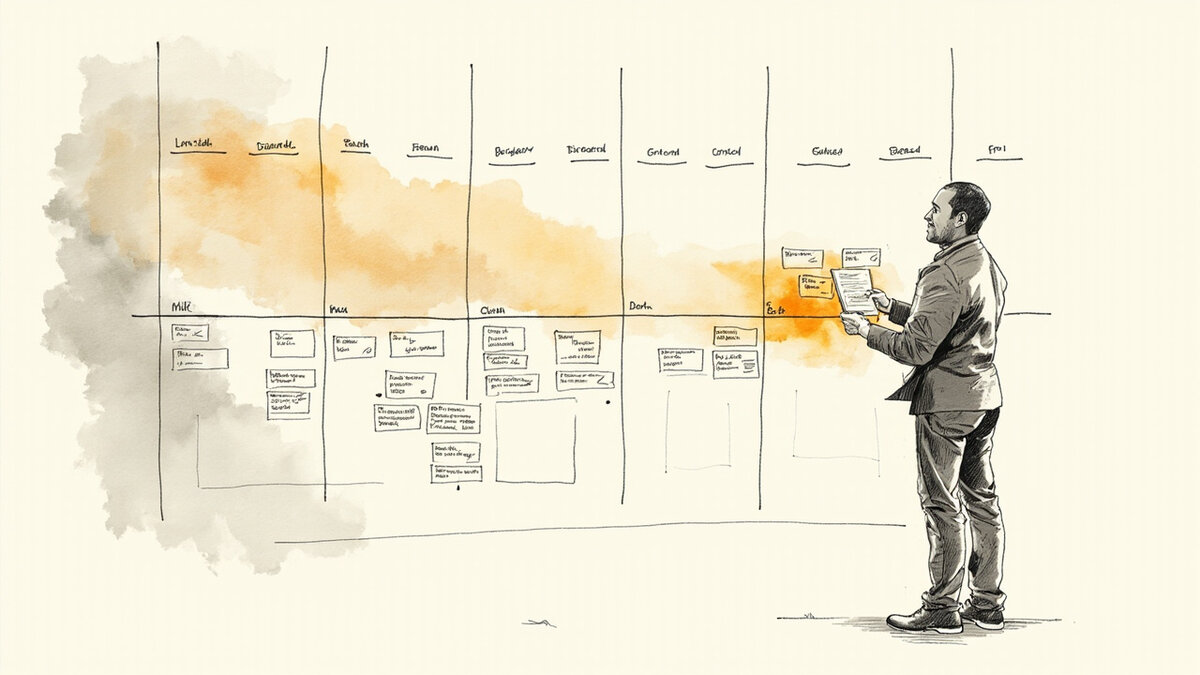
Social proof conversion rates: what the studies show
Social proof lifts conversion. The lift range, across multiple studies and contexts, is roughly 5-15% on average and up to 20-30% in specific contexts (landing pages, cold visitors, high-quality proof). The lift is real, but it varies by page type, visitor type, and the quality of the proof itself. The right expectation is “meaningful but context-dependent,” not “magic.”
This page is the conversion-impact question. The what is social proof page is the definition. The types of social proof page is the 8-type typology. The social proof examples page is the worked examples. The social proof on websites page is the page-by-page placement. This page is the conversion-impact decision framework.
The 5 studies and the lift range
The most-cited studies in the social proof CRO space show consistent direction (positive lift) with variable magnitude. The conversion lift from social proof, across the studies, ranges from 5% to 30%, with most studies showing 5-15% as the average and 20-30% as the high-end. The range is wide because the studies test different page types, different visitor types, and different social proof qualities.
The 5 most-referenced studies: the Spiegel catalog study (cited 15% lift from customer reviews), the Cialdini reciprocity study (the foundational psychology of social proof), and the Baymard Institute findings (e-commerce checkout optimization).
The ConversionXL case studies (CRO agency research showing 5-15% lift on landing pages with social proof) and the WiderFunnel experimental research (A/B testing methodology with multiple social proof tests) round out the 5.
The studies converge on the direction (positive) and the range (5-30%). The studies diverge on the specific lift (because the contexts differ). The team should expect a 5-15% lift as the realistic baseline, with higher lifts possible in specific contexts.
The page-type matrix
The page-type matrix shows where social proof produces the most lift. The lift varies by page type because the visitor’s need varies by page type.

Landing page (highest lift, 10-30%): The visitor has just arrived from an ad, email, or referral. The visitor is at the consideration stage. The visitor needs any signal at all. Social proof at this stage is the highest-leverage placement. The lift is the highest because the visitor has the most uncertainty.
Homepage (high lift, 8-15%): The visitor is exploring the brand. The visitor needs recognition (logos) and credibility (testimonials). Social proof at this stage reduces uncertainty. The lift is high because the visitor is still in the consideration phase.
Pricing page (medium lift, 5-12%): The visitor is comparing plans. The visitor needs plan-specific social proof. Social proof at this stage reduces the “is this for me” uncertainty. The lift is medium because the visitor has already done some evaluation.
Product page (medium lift, 5-10%): The visitor is evaluating the product. The visitor needs feature-specific social proof. The lift is medium because the visitor is feature-driven, not proof-driven.
Checkout page (lowest lift, 2-5%): The visitor has decided to buy. The visitor needs final trust signals. The lift is lowest because the visitor has already committed.
The visitor-type matrix
The visitor-type matrix shows where social proof produces the most lift. The lift varies by visitor type because the visitor’s trust needs vary by visitor type.
Cold visitors (highest lift, 15-30%): The visitor has no prior relationship with the brand. The visitor is evaluating based on external signals. Social proof is the most leveraged. The lift is the highest because the visitor has the least prior context.
Warm visitors (medium lift, 5-15%): The visitor has some prior context (has read a blog post, has interacted with a comparison page). The visitor is confirming. The lift is medium because the visitor already has some context to lean on.
Hot visitors (lowest lift, 2-5%): The visitor has decided to buy. The visitor is filling out the form. The lift is lowest because the visitor does not need additional proof.
The social-proof-type matrix
Not all 8 types of social proof produce the same lift. The lift varies by type because the trust signal varies by type.
Customer testimonials (highest trust): Named customers, specific outcomes, attributed. The lift is highest because the trust is highest. The reader verifies by looking up the customer.
Case studies (deep trust): Long-form, detailed, with metrics. The lift is high because the depth is the trust. The reader invests time to read, and the trust is built by depth.
Customer logos (recognition trust): Recognized brands. The lift is high because recognition is fast. The reader recognizes the brand and the trust is built by recognition.
Star ratings (count trust): Third-party platforms, large numbers. The lift is medium because the count is the trust. The reader trusts the count, not the individual stars.
Customer count (volume trust): “Used by 10,000+ teams.” The lift is lower because the count is abstract. The reader trusts the volume, but the volume is not as specific as a named customer.
The 3 conditions for the lift
The first condition is authenticity. The social proof is real. The customer is real. The outcome is real. The reader can verify. Authentic social proof produces lift. Fabricated social proof produces risk.
The second condition is specificity. The social proof is specific. The customer is named. The outcome is measurable. The context is clear. Specific social proof produces lift. Generic social proof produces noise.
The third condition is placement. The social proof is near the ask. The testimonial is next to the CTA. The logo wall is above the fold. Placed social proof produces lift. Buried social proof produces nothing.
The 3 things that prevent the lift
The first preventer is fake social proof. The reader can spot fake social proof. The reader does not trust the page. The reader leaves. The lift goes negative. The team should not use fabricated testimonials, no matter the temptation.
The second preventer is generic social proof. “Great product, highly recommend” produces no lift. The reader cannot verify. The reader is not moved. The team should aim for specific, attributable social proof, not generic praise.
The third preventer is wrong placement. The testimonial is in the footer. The logo wall is on the about page. The placement is far from the ask. The reader does not see the proof at the moment of decision. The lift does not materialize.
The realistic expectations and the first test
The realistic expectation: 5-15% lift as the baseline, with 15-30% lift possible in the highest-leverage contexts. The team should plan for the lower bound and be pleasantly surprised by the upper bound.
The first test to run: pick the highest-leverage page (the landing page, if there is one), add the highest-leverage social proof (a named customer testimonial with a specific outcome), place it near the CTA, and measure the conversion rate for 2-4 weeks. The test is the answer to the question “does social proof lift our conversion.” The result is the data for the next decision.
The team that runs the test gets the answer. The team that does not run the test gets a guess. The lift is real on average. The specific lift for the team’s site is only knowable by testing.
The 4 testimonial-specific conversion lifts
While social proof in general lifts conversions 5-15%, testimonials specifically drive 4 distinct conversion outcomes above and beyond the baseline. Each is measurable.
Lift 1: Testimonials on the homepage lift signup conversion by 8-15%. The homepage is the first credibility gate. A visitor who sees 3-5 testimonials with photos, names, and quantified outcomes is more likely to convert than a visitor who sees only the value proposition.
Lift 2: Testimonials on the pricing page lift trial signup by 10-20%. The pricing page is the highest-intent moment. Visitors are comparing options. A testimonial next to each pricing tier addresses the buyer’s specific objection at that price point.
Lift 3: Testimonials in abandoned cart emails lift recovery by 5-12%. The buyer who abandoned has reconsidered. A testimonial in the recovery email reminds them why they were buying in the first place.
Lift 4: Testimonials on the checkout page lift completion by 3-8%. The checkout page has the highest abandonment rate in the funnel. A single testimonial near the “place order” button reduces last-mile anxiety.
The 3 conversion lifts that are NOT attributable to testimonials
Many conversion lifts get attributed to testimonials when they actually come from other factors. The 3 attribution errors below are the most common.
Error 1: Branding improvements. If you redesigned your homepage and added testimonials at the same time, the conversion lift may be from the redesign, not the testimonials. Run testimonials on a page that has not been redesigned to isolate the lift.
Error 2: Pricing changes. If you lowered prices and added testimonials, the conversion lift may be from the lower prices. Run testimonials at the same price as the baseline to isolate the lift.
Error 3: Traffic quality changes. If your traffic source shifted from cold to warm (e.g., you turned on retargeting), the conversion lift may be from warmer traffic, not testimonials. Compare conversion rates on the same traffic source before and after adding testimonials.
The right measurement isolates the testimonial impact. Without isolation, the testimonial gets credit for improvements that came from elsewhere.
How to measure conversion lift from testimonials
The 3-step measurement framework below produces reliable data on testimonial impact.
Step 1: Establish baseline. Pick a page where you want to add testimonials. Record conversion rate, bounce rate, and time-on-page for 30 days before adding testimonials. This is your baseline.
Step 2: Add testimonials. Place 3-5 testimonials on the page using the format and placement most likely to work (inline single testimonial, near CTA, etc.). Record the same metrics for 30 days after.
Step 3: Compare and validate. Compare the post-testimonial conversion rate to the baseline. If the lift is 5%+ and bounce rate is stable, the testimonials are working. If conversion is flat or bounce rate is up, the testimonials are not working and need to be repositioned or replaced.
The framework takes 60 days to run. The data is reliable. The lift, if real, persists as long as the testimonials stay relevant.
The 3 testimonial attributes that drive the most conversion
Not every testimonial attribute converts equally. The 3 attributes below drive disproportionately more conversion than others.
Attribute 1: Quantified outcome. Testimonials with specific numbers (e.g., “increased conversions by 32%”) convert 2-3x better than testimonials with general praise (“great product”). Numbers make testimonials credible.
Attribute 2: Photo of the customer. Testimonials with photos convert 1.5-2x better than text-only testimonials. The photo proves a real person is behind the quote.
Attribute 3: Named company with size. Testimonials that name the customer’s company and size (“Sarah, CMO at a 50-person SaaS”) convert 1.5x better than testimonials from anonymous customers. The buyer mentally compares themselves to the named customer.
Maximize these 3 attributes in every testimonial you collect. Reject testimonials that lack all 3 unless they fill a specific niche (e.g., a vertical that is not represented in the wall).
How testimonials interact with other conversion factors
Testimonials do not work in isolation. They interact with 3 other conversion factors. Understanding the interactions prevents wasted effort.
Interaction 1: Page load speed. Slow pages with testimonials convert worse than fast pages without testimonials. If your page loads in 4+ seconds, optimize page speed before adding more testimonials.
Interaction 2: Mobile experience. Testimonials that look great on desktop can break on mobile. Test mobile rendering before declaring the testimonials effective. Most modern testimonial platforms handle mobile automatically, but custom implementations often miss it.
Interaction 3: Page content quality. Testimonials cannot rescue a weak value proposition. If the page does not clearly explain what the product does and who it is for, testimonials amplify skepticism (“this product has so many testimonials, why is it so unclear?”). Fix the value proposition first.
Testimonials are a conversion multiplier. They make good pages better. They do not make bad pages good. The right sequence is value proposition clarity, then testimonials.
The journey after this page
If you have the conversion-impact framework and want the definition of social proof, the what is social proof page is the parent reference. For the 8 types in concept, the types of social proof page is the typology reference.
For the worked examples of each type, the social proof examples page is the gallery reference. For the page-by-page placement, the social proof on websites page is the implementation reference.
For the testimonial-specific placement and the 7 patterns, the displaying testimonials page is the dedicated reference.
For teams that want to test social proof with the modern stack (server-rendered testimonials, schema markup, AI citability) on a free plan, Testivo is one tool that ships the right kind of social proof for the test. The test is the answer. The tool is the medium. The lift is the result.
For the trust badge decision, the trust badges page is the dedicated reference. For the marketing strategy, the testimonial marketing page is the dedicated reference. Related: conversion statistics. Related: funnel conversion lift.
Your next move: pick one page on your site that currently has no social proof (likely a product or pricing page). Add a single, specific testimonial with named attribution above the fold. Measure conversion before and after for 14 days. Most pages see 5-15% lift from this single change. If lift is confirmed, expand to the next 2-3 pages.